

Old crop canola slipped on Wednesday while new crop November was unchanged.
Crop markets generally dipped by only a few cents a bushel today.
The Canadian market was marking time, waiting for Thursday’s Statistics Canada survey on seeding intentions.
Reuters said U.S. corn futures touched a one-month low and soybeans dropped on concern that a bird flu outbreak in the United States may cut feed demand.
Forecasts for favourable U.S. planting weather in coming weeks also weighed on prices.
Read Also
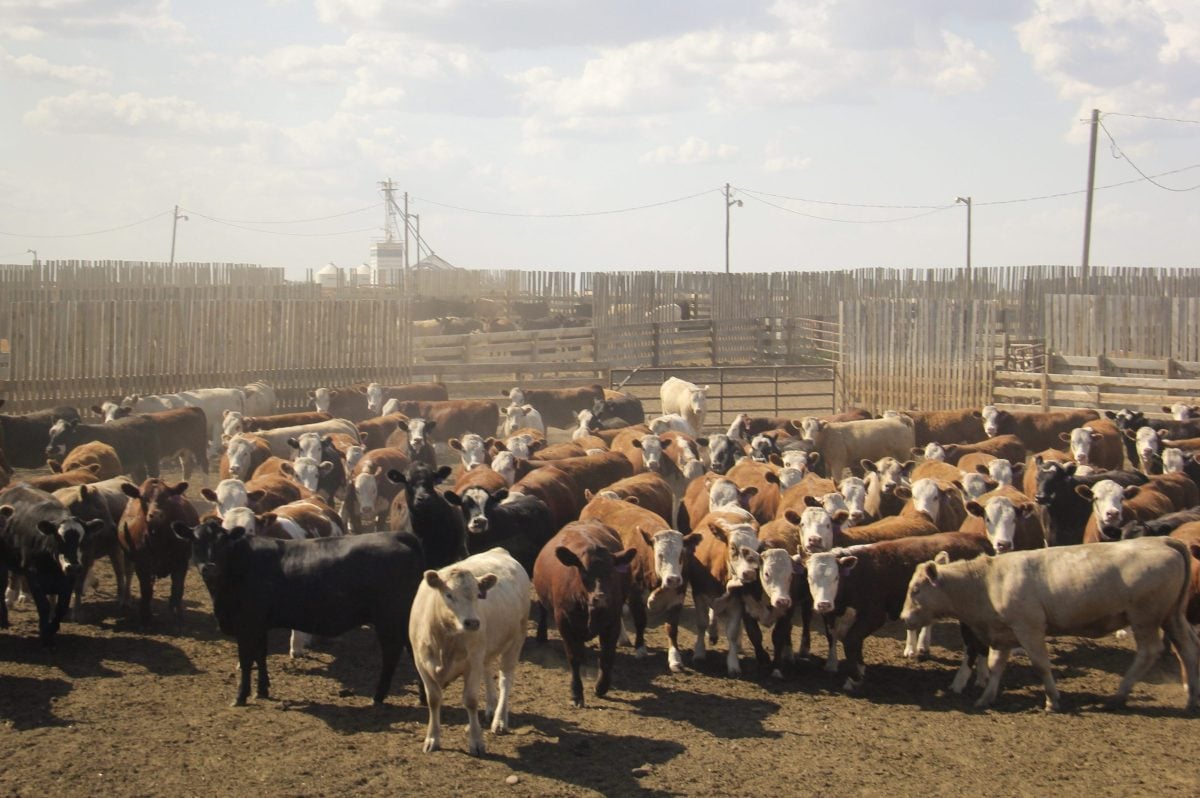
U.S. livestock: Hog futures hit contract highs on shock herd decline
Chicago | Reuters – Lean hog futures stormed to contract highs at the Chicago Mercantile Exchange on Friday as smaller-than-expected…
Wheat was slightly lower as early short covering support faded in light trading.
U.S. Midwest weather was cooler than normal but largely free of precipitation on Wednesday. Recent rains recharged soils with moisture but have delayed early planting progress.
“The rains have been a great benefit to the dry soils that are starting to get built back up so there’s really not much as far as drought in the heart of the corn belt,” said Karl Setzer, analyst with MaxYield Cooperative.
Concerns that an outbreak of a lethal strain of bird flu in the United States would hurt corn and soymeal demand continued to hang over the market.
“Soybean and corn prices are still suffering today from the psychological impact of the bird flu discoveries in the United States while the markets were also calmed by the latest figures showing good U.S. corn and spring wheat plantings progress in the United States,” said Stefan Vogel, head of agricultural commodity markets research at Rabobank.
Reuters said ample global supplies of wheat and limited export demand for high-priced U.S. supplies anchored wheat prices, but a large net short position held by commodity funds in the market had led to short-covering bounces at times.
U.S. wheat was not competitively priced in a recent international tender by Iraq, and U.S. supplies were not included in a large purchase by top importer Egypt over the weekend.
Light crude oil nearby futures in New York were down 45 cents to US$56.16 per barrel.
The Canadian dollar at noon was US81.63 cents, up from 81.47 cents the previous trading day. The U.S. dollar at noon was C$1.2250.
The Toronto Stock Exchange’s S&P/TSX composite index ended the session down 41.67 points, or 0.27 percent, at 15,304.77.
The Dow Jones industrial average rose 88.01 points, or 0.49 percent, to 18,037.6, the S&P 500 gained 10.65 points, or 0.51 percent, to 2,107.94 and the Nasdaq Composite added 21.07 points, or 0.42 percent, to 5,035.17.
Winnipeg ICE Futures Canada dollars per tonne
Canola May 2015 445.10 -1.40 -0.31%
Canola Jul 2015 451.50 -0.50 -0.11%
Canola Nov 2015 446.00 unch 0.00%
Canola Jan 2016 447.20 +0.30 +0.07%
Canola Mar 2016 447.50 +0.30 +0.07%
Milling Wheat May 2015 205.00 unch 0.00%
Milling Wheat Jul 2015 207.00 unch 0.00%
Milling Wheat Oct 2015 212.00 unch 0.00%
Durum Wheat May 2015 313.00 unch 0.00%
Durum Wheat Jul 2015 303.00 unch 0.00%
Durum Wheat Oct 2015 308.00 unch 0.00%
Barley May 2015 207.00 unch 0.00%
Barley Jul 2015 207.00 unch 0.00%
Barley Oct 2015 192.00 unch 0.00%
American crop prices in cents US/bushel, soybean meal in $US/short ton, soy oil in cents US/pound
Chicago
Soybeans May 2015 970.5 -4.75 -0.49%
Soybeans Jul 2015 971.75 -5 -0.51%
Soybeans Aug 2015 968.25 -5.5 -0.56%
Soybeans Sep 2015 957.25 -4.75 -0.49%
Soybeans Nov 2015 953.75 -3 -0.31%
Soybeans Jan 2016 960.25 -3 -0.31%
Soybean Meal May 2015 315.5 -0.3 -0.09%
Soybean Meal Jul 2015 313.8 -1.1 -0.35%
Soybean Meal Aug 2015 312.2 -1.1 -0.35%
Soybean Oil May 2015 31.56 -0.26 -0.82%
Soybean Oil Jul 2015 31.75 -0.27 -0.84%
Soybean Oil Aug 2015 31.82 -0.25 -0.78%
Corn May 2015 372.5 -0.5 -0.13%
Corn Jul 2015 379.5 -0.5 -0.13%
Corn Sep 2015 387.5 -0.25 -0.06%
Corn Dec 2015 397.5 unch 0.00%
Corn Mar 2016 407.75 unch 0.00%
Oats May 2015 258.75 -0.75 -0.29%
Oats Jul 2015 262.25 -1.25 -0.47%
Oats Sep 2015 268.5 -1.5 -0.56%
Oats Dec 2015 274.25 -1.25 -0.45%
Oats Mar 2016 279.75 +0.25 +0.09%
Wheat May 2015 498.75 -2 -0.40%
Wheat Jul 2015 499 -1.25 -0.25%
Wheat Sep 2015 507.75 -1.25 -0.25%
Wheat Dec 2015 523.5 -0.75 -0.14%
Wheat Mar 2016 538 -0.75 -0.14%
Minneapolis
Spring Wheat May 2015 543.75 -1.5 -0.28%
Spring Wheat Jul 2015 555.75 -2.25 -0.40%
Spring Wheat Sep 2015 564.75 -1.75 -0.31%
Spring Wheat Dec 2015 575.5 -1 -0.17%
Spring Wheat Mar 2016 588.75 -1.25 -0.21%
Kansas City
Hard Red Wheat May 2015 512 -1.75 -0.34%
Hard Red Wheat Jul 2015 517.25 -1.75 -0.34%
Hard Red Wheat Sep 2015 527.5 -2 -0.38%
Hard Red Wheat Dec 2015 546 -1.25 -0.23%
Hard Red Wheat Mar 2016 558.5 -1.5 -0.27%


