ICE Canada canola futures dipped on Wednesday, snapping a three-day advance, on commercial hedge pressure and weaker soy markets.
Farmer selling has increased with the pace of the Canadian harvest picking up, a trader said.
November canola lost $5.50 to $464.20 per tonne.
January canola down $5.20 to $471.40.
Rain is expected on the Prairies on Friday and Saturday.
OUR WEEKLY MARKETS VIDEO WILL BE ISSUED THURSDAY
U.S. soybean and corn futures fell on Thursday, pressured by profit taking after a streak of
Read Also
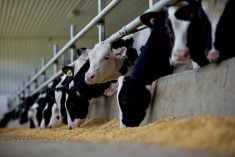
Confusion cleared on Canadian calf import changes
A Canadian Food Inspection Agency (CFIA) announcement on import regulations for feeder calves caused some confusion on the administrative side of Canada’s cattle industry earlier this month
Wheat futures rose slightly, with short-covering supporting prices despite a glut of global supplies.
Soybeans notched the biggest decline, after a four-session rally pushed prices to their highest in
nearly a month.
Traders said farmers in parts of the Midwest were aggressive sellers of recently harvested soybeans, causing commercial operators to hedge cash market deals with sales in the futures market. Cash market bids for corn also were weaker as many growers began to harvest.
Weather forecasts for the Midwest for the weeks ahead “still do not look ideal for an extended harvest window, but central and eastern belt farmers should at least be able to make good headway in the coming days, starting to bring in these record 2016 U.S. crops,” Matt Zeller, director of market information at INTL
FCStone, said in a note to clients.
“There is some selling pressure today in soybeans and corn following their rises in past days, said Graydon Chong, senior
commodities analyst with Rabobank.
“But markets remain relatively rangebound, with corn especially reaching the upper parts of its range so it is not unusual to see a move down at such a point in markets.”
In the wheat market, the focus turned to Indian demand.
Indian importers have purchased around 76,000 tonnes of Ukrainian-origin wheat in the past couple of weeks as India
steps up purchases after two years of poor output.
“If the Indian government decides to remove its import duty on wheat there could be big new sales to India in the near
future,” one European trader said.
The Toronto Stock Exchange’s S&P/TSX composite index closed up 188.84 points, or 1.30 percent, at 14,710.82.
The Dow Jones industrial average rose 163.81 points, or 0.9 percent, to 18,293.77, the S&P 500 gained 23.34 points, or 1.09 percent, to 2,163.1 and the Nasdaq Composite added 53.83 points, or 1.03 percent, to 5,295.18.
Light crude oil nearby futures in New York were up $1.29 to US$45.34 per barrel.
The Canadian dollar at noon was US75.84 cents, up from 75.60 cents the previous trading day. The U.S. dollar at noon was C$1.3186.
Winnipeg ICE Futures Canada dollars per tonne
Canola Nov 2016 464.20 -5.50 -1.17%
Canola Jan 2017 471.40 -5.20 -1.09%
Canola Mar 2017 478.20 -5.10 -1.06%
Canola May 2017 484.00 -5.20 -1.06%
Canola Jul 2017 487.60 -5.90 -1.20%
Milling Wheat Oct 2016 213.00 +1.00 +0.47%
Milling Wheat Dec 2016 216.00 unch 0.00%
Milling Wheat Mar 2017 221.00 unch 0.00%
Durum Wheat Oct 2016 274.00 unch 0.00%
Durum Wheat Dec 2016 275.00 unch 0.00%
Durum Wheat Mar 2017 280.00 unch 0.00%
Barley Oct 2016 135.00 unch 0.00%
Barley Dec 2016 135.00 unch 0.00%
Barley Mar 2017 137.00 unch 0.00%
American crop prices in cents US/bushel, soybean meal in $US/short ton, soy oil in cents US/pound
Chicago
Soybeans Nov 2016 975.50 -14.25 -1.44%
Soybeans Jan 2017 981.00 -13.75 -1.38%
Soybeans Mar 2017 984.75 -13.25 -1.33%
Soybeans May 2017 990.25 -12.50 -1.25%
Soybeans Jul 2017 995.00 -11.75 -1.17%
Soybeans Aug 2017 992.75 -11.25 -1.12%
Soybean Meal Oct 2016 308.70 -4.40 -1.41%
Soybean Meal Dec 2016 308.70 -4.50 -1.44%
Soybean Meal Jan 2017 309.50 -4.30 -1.37%
Soybean Oil Oct 2016 33.40 -0.43 -1.27%
Soybean Oil Dec 2016 33.66 -0.43 -1.26%
Soybean Oil Jan 2017 33.89 -0.42 -1.22%
Corn Dec 2016 340.00 -0.50 -0.15%
Corn Mar 2017 350.00 -0.75 -0.21%
Corn May 2017 357.00 -1.00 -0.28%
Corn Jul 2017 363.75 -0.50 -0.14%
Corn Jul 2017 363.75 -0.50 -0.14%
Corn Sep 2017 370.00 -0.75 -0.20%
Oats Dec 2016 176.25 +1.25 +0.71%
Oats Mar 2017 188.00 +1.00 +0.53%
Oats May 2017 194.00 +1.50 +0.78%
Oats Jul 2017 200.25 +1.25 +0.63%
Oats Sep 2017 200.25 +1.25 +0.63%
Wheat Dec 2016 407.75 +1.75 +0.43%
Wheat Mar 2017 429.25 +2.50 +0.59%
Wheat May 2017 442.75 +2.75 +0.62%
Wheat Jul 2017 451.25 +1.75 +0.39%
Wheat Sep 2017 464.75 +1.00 +0.22%
Minneapolis
Spring Wheat Dec 2016 494.75 +3.50 +0.71%
Spring Wheat Mar 2017 504.00 +2.75 +0.55%
Spring Wheat May 2017 512.25 +2.00 +0.39%
Spring Wheat Jul 2017 521.00 +2.00 +0.39%
Spring Wheat Sep 2017 530.75 +1.75 +0.33%
Kansas City
Hard Red Wheat Dec 2016 422.25 +3.75 +0.90%
Hard Red Wheat Mar 2017 438.75 +4.00 +0.92%
Hard Red Wheat May 2017 449.00 +3.75 +0.84%
Hard Red Wheat Jul 2017 458.50 +3.50 +0.77%
Hard Red Wheat Sep 2017 472.00 +3.00 +0.64%
Chicago livestock futures in US¢/pound (rounded to two decimal places)
Live Cattle (P) Oct 2016 108.55 +0.88 +0.82%
Live Cattle (P) Dec 2016 108.35 +1.30 +1.21%
Live Cattle (P) Feb 2017 108.48 +1.01 +0.94%
Feeder Cattle (P) Sep 2016 136.35 +1.03 +0.76%
Feeder Cattle (P) Oct 2016 132.22 +1.10 +0.84%
Feeder Cattle (P) Nov 2016 129.68 +0.83 +0.64%
Lean Hogs (P) Oct 2016 54.42 -1.13 -2.03%
Lean Hogs (P) Dec 2016 48.25 -0.83 -1.69%
Lean Hogs (P) Feb 2017 53.10 -0.27 -0.51%