
Whether you know it or not, you will go through a nutrient plan; either on paper or in your mind.
You will have just completed the harvest phase of your nutrient plan.
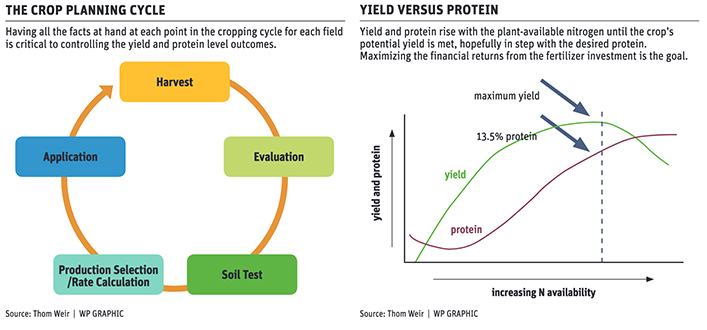
A plan may look something like this.
The evaluation phase may be confusing and difficult, because, as every farmer knows, every year is different. Last year, you might have applied 120 pounds of nitrogen to your canola and got a 65 bushel, 12.5 percent protein wheat crop.
This year, you did everything the same and you only got 45 bu., but the crop was 14.5 percent protein.
Read Also

Organic farmers urged to make better use of trade deals
Organic growers should be singing CUSMA’s praises, according to the Canadian Chamber of Commerce.
A useful tool in evaluating last year’s nitrogen application is to look at your hard red spring wheat protein. The protein level can be used as a barometer to evaluate your past year’s application.
Before we look at the protein, we must consider the fact that for most of the Canadian Prairies and the Northern Plains in the United States, the most limiting input in most years is water. Regardless of the amount of nutrients applied, in a dry year, you won’t produce another bushel of grain by applying an additional 10 lb. of nitrogen. This goes back to Liebig’s Law of the Minimum. In summary, it states that growth is dictated not by total resources available, but by the scarcest resource, its limiting factor.
Wheat, and especially hard red spring wheat, is interesting in that there is a clearly defined protein level that indicates when the maximum yield has been obtained. It appears that wheat is able to partition the nitrogen and, when in limited supplies, divert it to produce yield. As the maximum yield is approached, it then converts more nitrogen to increase protein. The protein percent has been determined to be 13.5 percent in studies done with various hard red spring wheat varieties. This point is not as consistent with winter wheat but is around 11 percent.
Using this observation, you can look at the percentage of protein you obtained in various fields. If you have 12.5 percent protein, it indicates that you left yield on the table — or that you could have increased your yield in that field by applying more nitrogen.
On the other hand, if you have another field that maybe missed some rain and the protein is 14.5 percent, it would indicate that you maximized the yield for the rainfall you received and that there was extra nitrogen that went to protein.
A field that had an average of 13 to 14 percent indicates that you pretty well nailed your nitrogen rate to the moisture, and you maximized your yield. Using these observations as a barometer means the lower your protein, the more yield you left and probably the more you under-fertilized with nitrogen. The higher your protein above 13.5 percent indicates the more you overshot your nitrogen, unless you were shooting for higher protein, and that there is probably some nitrogen left in the soil for next year.
It’s not completely that simple. There are other factors, such as volatilization or denitrification that may affect the protein or nitrogen gains. However, it is a useful tool that you can use when evaluating the past year’s nitrogen performance.
The same idea can be used for most cereal crops. The sweet spot for winter wheat is around 11 percent and for malt barley and Canada prairie spring wheat the range is about11.5 to 12.5 percent.
However, it can get tricky with malt barley because maltsters look for barley with protein from 9.5 to 12.5 percent. If you are shooting for maximum yield, your protein may not be acceptable to some malt barley buyers.
This summary of how to use your protein levels in cereals will hopefully allow you to better evaluate your nitrogen management package.