Glacier FarmMedia – Last year, farmers across the Canadian Prairies got a new tool to gauge how much risk their cereal crops face from fusarium head blight (FHB). Now, with winter wheat crops approaching flowering, the Manitoba Crop Alliance is reminding growers about the tool and giving tips on how to use it.
WHY IT MATTERS: Fusarium head blight not only reduces crop yields, but can also produce mycotoxins that make grain unsuitable for human or animal consumption, leading to marketing penalties.
The Fusarium Head Blight Risk Mapping Tool, hosted by the University of Manitoba, is a major upgrade from previous forecasting systems, said Andrew Hector, agronomy extension specialist with the alliance.
Read Also
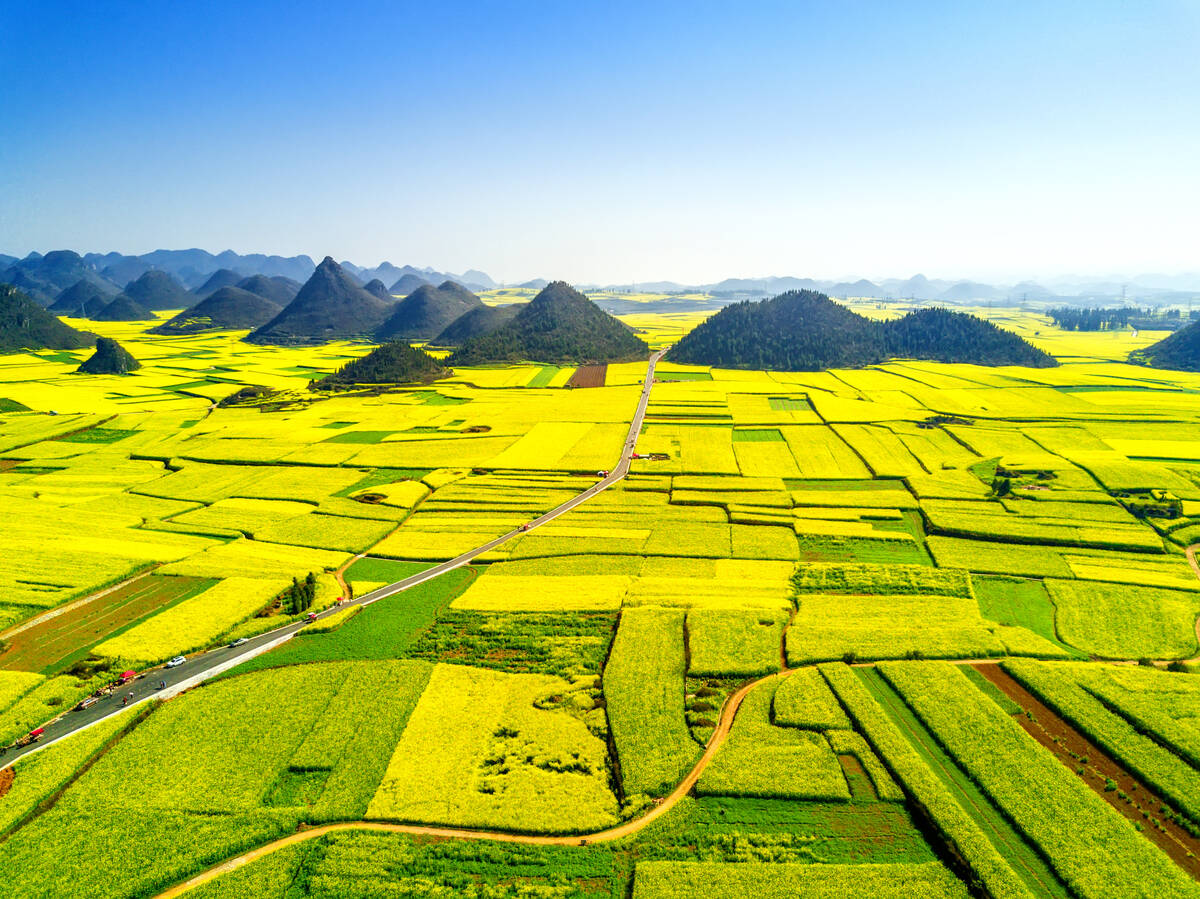
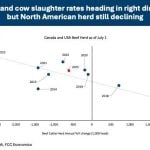
Short rapeseed crop may put China in a bind
Industry thinks China’s rapeseed crop is way smaller than the official government estimate. The country’s canola imports will also be down, so there will be a lot of unmet demand.
The mapping tool is a more local take on the fight against FHB, says the alliance’s website. Before last year, it noted, the Prairie provinces derived their FHB forecasts from United States models that had been adjusted for the region.
“However, due to the differences between the models used in each province, the past maps could show different risk levels,” the website states. “This was especially an issue for producers along provincial borders, who could receive different risk levels depending on which provincial map they viewed.”
Building a fusarium head blight tool
The new tool looked local to build its forecasting model. Data was drawn from a research project led by the U of M’s Paul Bullock.. Between 2018 and 2023, researchers collected FHB data from over 1,800 plots spread across the Prairies, with an additional 300 producer fields used for validation.
“The models are (a) very much Western Canadian, Prairie-made model and risk mapping tool,” Hector said during a recent Crop Talk webinar hosted by Manitoba Agriculture.
The current system addresses several limitations of the old forecasting maps that frustrated farmers. Those documents, hosted on the Manitoba Agriculture website, were static images updated only on weekdays.
“This usually left a gap in time during weekends where no map updates were occurring,” Hector said.
And because they were static, they provided a good overview idea of FHB risk, but no ability for a farmer to really zoom in on specific parts of the province, he added.

The system itself was also long in the tooth.
“The models were over 20-years-old, so some questions were coming about its accuracy and just the need for updating it with the change of weather patterns,” Hector said.
The new tool, in contrast, allows users to zoom into specific regions, choose dates ranges and crop types, and export customized maps.
Fusarium risk by crop
For the first time, the tool also includes risk models for multiple crop types, including spring wheat, winter wheat, barley and durum. Previously, maps were only specific to spring wheat and applicable somewhat to winter wheat.
The tool also allows customization according to variety.
“The models are developed independently for each crop type and selected based off of their individual statistical accuracy,” Hector said. “Each algorithm uses different weather parameters as well, so the risk levels determined at a given location at a given day can actually vary between the models.”

Reading the risk maps
The mapping tool displays risk levels in colour-coded categories: low (green), moderate (yellow), high (red) and very high (black). Users can also view time-lapse animations showing how risk levels have changed over recent days, helping farmers understand disease pressure trends in their area.
The tool operates from May 15 to Aug. 31 each year and draws weather data from over 130 weather stations in Manitoba alone, including the Manitoba Agriculture weather station network and Environment and Climate Change Canada stations. Farmers can access the tool at prairiefhb.ca.
Farmers still have to scout
Despite the mapping tool’s sophistication, Hector said that it should work alongside, not replace, traditional field scouting. The risk maps only provide information about environmental conditions favourable for disease development. Farmers still need to determine if their fields match the crop susceptibility timing shown on the maps.
“The risk maps are based on models, and no models are 100 per cent accurate, so therefore this map needs to be used in tandem with traditional scouting methods to determine fusarium head blight risk for individual fields,” Hector said.
Future work on the digital tool
Researchers hope to address a number of remaining limitations in future versions of the mapping tool.
Unlike weather forecasting, the system cannot predict future risk levels beyond the current date, Hector said.
“At this point, this tool does not have that functionality. I believe that is something that the researchers have thought of, and depending on a lot of different aspects, would like to add to it, but it’s not available currently,” he said.
The risk parameters also vary by crop type. Winter wheat and barley currently only show fusarium head blight risk, while spring wheat includes additional risk categories for fusarium damaged kernels and deoxynivalenol (DON) levels—both determined through laboratory analysis rather than visual field symptoms.
“Maybe in the future, these risks will be rolled out for all crop types,” Hector said.