

WINNIPEG, (MarketsFarm) – Intercontinental Exchange (ICE) Futures canola contracts were weaker on Wednesday, due to the weather forecast and spillover from the Chicago Board of Trade.
“A little rain in the forecast put some pressure on the market. The potential for rain across the Prairies is good, but it doesn’t look like heavy rain,” said a Winnipeg-based analyst.
Read Also
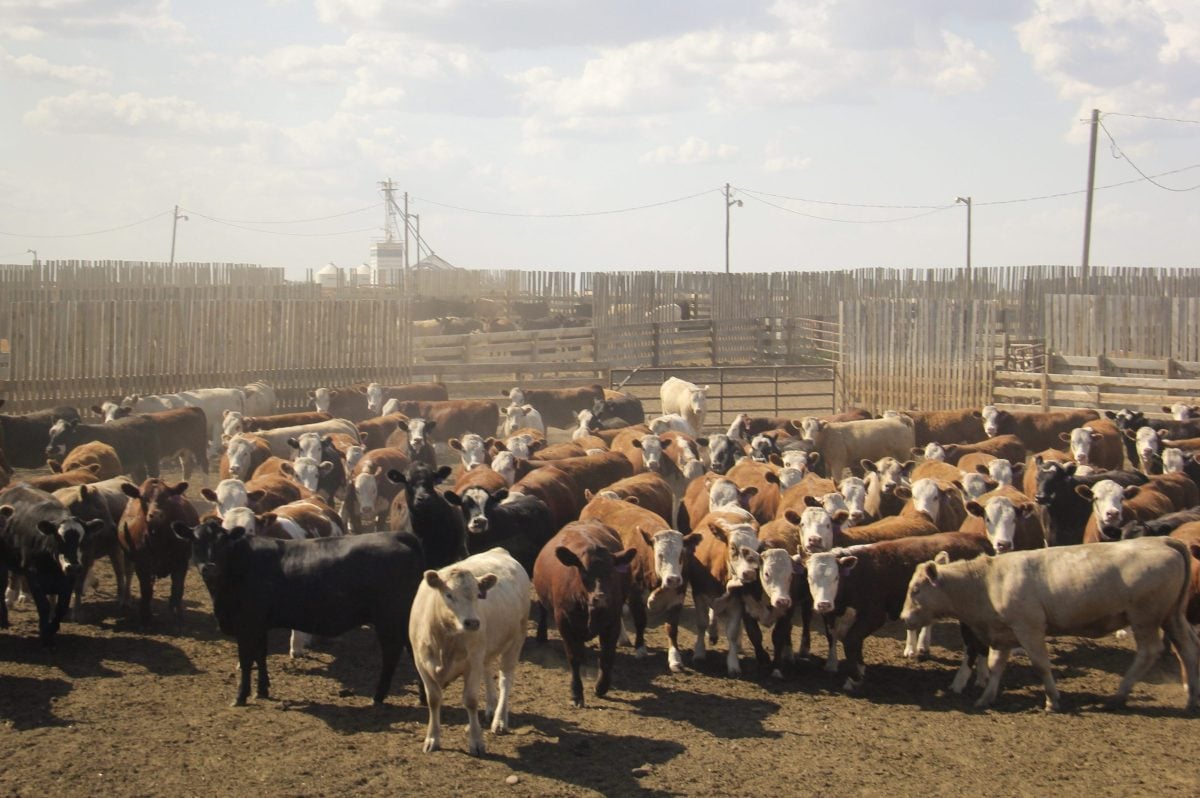
U.S. livestock: Hog futures hit contract highs on shock herd decline
Chicago | Reuters – Lean hog futures stormed to contract highs at the Chicago Mercantile Exchange on Friday as smaller-than-expected…
There were significant losses in Chicago today, as soybeans, corn and wheat lost ground.
There were 25,312 contracts traded on Wednesday, which compares with Tuesday when 39,712 contracts changed hands. Spreading accounted for 16,212 contracts traded.
Settlement prices are in Canadian dollars per metric tonne.
Price Change
Canola Jul 455.50 dn 5.00
Nov 469.30 dn 6.70
Jan 475.90 dn 7.00
Mar 481.60 dn 7.20
SOYBEAN futures at the Chicago Board of Trade (CBOT) were weaker on Wednesday, as profit-taking, technical selling and expectations of mediocre export sales drove down prices.
The United States Department of Agriculture (USDA) is scheduled to release its export sales report on Thursday. The markets believe 198,000 to 800,000 tonnes of soybeans will be sold. Along with 100,000 to 400,000 tonnes of soymeal and 5,000 to 25,000 tonnes of soyoil.
Chinese President Xi Jinping and U.S. President Donald Trump will meet at the G20 Summit in Japan next week. The two are expected to discuss trade and that could signal the resumption of U.S./China trade talks.
The Chicago Mercantile Exchange lifted its force majeure at soybean and corn shipping stations, as water levels have dropped on the Mississippi and Illinois Rivers.
CORN futures were lower on Wednesday, due to profit-taking, despite expectations of reduced production this year.
Market pegged its estimates of corn exports between 300,000 to 900,000 tonnes.
Farm Futures estimated U.S. corn production to be about 332.76 million tonnes this year. That’s a decline of 12.70 million tonnes from the USDA’s estimate.
Ethanol production in the U.S consumed about 27,460 tonnes per day between June 7 and 14. That’s down slightly from the previous week.
China’s corn production could reach 252 million tonnes, as cool, wet weather has set in. However, outbreaks of fall armyworms could hurt production in some regions.
With hot and dry weather, Ukraine’s corn crop has suffered. The USDA lowered its estimate of Ukraine’s 2019/20 corn production to 33.0 million tonnes, compared to the previous crop year’s 35.81 million tonnes.
WHEAT futures were weaker on Wednesday, also due to profit-taking.
The markets projected export sales of 198,000 to 500,000 tonnes of wheat.
The U.S. lost out on a tender issued by Egypt for about 291,000 tonnes of wheat. Egypt opted to buy less expensive wheat from Russia and Romania. U.S. wheat has been less competitive globally.
Light crude oil nearby futures in New York was down 14 cents at US$53.76 per barrel.
In the afternoon, the Canadian dollar was trading around US74.95 cents, up from 74.66 cents the previous trading day. The U.S. dollar was C$1.3343.
Winnipeg ICE Futures Canada dollars per tonne.
Canola Jul 19 455.50s -5.00 -1.09%
Canola Nov 19 469.30s -6.70 -1.41%
Canola Jan 20 475.90s -7.00 -1.45%
Canola Mar 20 481.60s -7.20 -1.47%
Canola May 20 486.20s -7.10 -1.44%
American crop prices in cents US/bushel, soybean meal in $US/short ton, soy oil in cents US/pound. Prices are displayed with fractions (2/8, 4/8, and 6/8) instead of decimals. -2 equals .25, -4 equals .50, -6 equals .75. The “s” means it is the settlement.
Chicago
Soybean Jul 19 903-2s -10-2 -1.12%
Soybean Aug 19 909-4s -10-6 -1.17%
Soybean Sep 19 916-0s -11-2 -1.21%
Soybean Nov 19 928-6s -11-4 -1.22%
Soybean Jan 20 941-0s -11-2 -1.18%
Soybean Meal Jul 19 316.9s -5.1 -1.58%
Soybean Meal Aug 19 318.2s -5.3 -1.64%
Soybean Meal Sep 19 319.8s -5.5 -1.69%
Soybean Oil Jul 19 28.37s +0.04 +0.14%
Soybean Oil Aug 19 28.50s +0.03 +0.11%
Soybean Oil Sep 19 28.61s +0.03 +0.10%
Corn Jul 19 441-0s -8-6 -1.95%
Corn Sep 19 446-2s -9-2 -2.03%
Corn Dec 19 453-2s -9-6 -2.11%
Corn Mar 20 458-6s -9-4 -2.03%
Corn May 20 460-2s -8-6 -1.87%
Oats Jul 19 285-4s -12-0 -4.03%
Oats Sep 19 284-4s -7-6 -2.65%
Oats Dec 19 288-4s -5-6 -1.95%
Oats Mar 20 292-2s -5-6 -1.93%
Oats May 20 291-4s -5-6 -1.93%
Wheat Jul 19 522-2s -9-2 -1.74%
Wheat Sep 19 526-6s -8-6 -1.63%
Wheat Dec 19 536-0s -10-6 -1.97%
Wheat Mar 20 546-4s -11-6 -2.10%
Wheat May 20 549-2s -13-0 -2.31%
Minneapolis
Spring Wheat Jul 19 541-4s -10-6 -1.95%
Spring Wheat Sep 19 548-4s -10-2 -1.83%
Spring Wheat Dec 19 561-0s -10-2 -1.79%
Spring Wheat Mar 20 573-2s -10-4 -1.80%
Spring Wheat May 20 581-2s -10-4 -1.77%
Kansas City
Hard Red Wheat Jul 19 457-4s -7-6 -1.67%
Hard Red Wheat Sep 19 468-0s -9-0 -1.89%
Hard Red Wheat Dec 19 490-0s -9-2 -1.85%
Hard Red Wheat Mar 20 511-0s -9-6 -1.87%
Hard Red Wheat May 20 524-0s -8-6 -1.64%
Chicago livestock futures in US¢/pound, Pit trade
Live Cattle Jun 19 108.500s -0.950 -0.87%
Live Cattle Aug 19 104.550s -1.000 -0.95%
Live Cattle Oct 19 106.100s -0.950 -0.89%
Feeder Cattle Aug 19 136.525s -0.725 -0.53%
Feeder Cattle Sep 19 137.000s -0.600 -0.44%
Feeder Cattle Oct 19 137.425s -0.275 -0.20%
Lean Hogs Jul 19 81.625s +0.150 +0.18%
Lean Hogs Aug 19 83.000s +1.300 +1.59%
Lean Hogs Oct 19 77.450s +0.850 +1.11%


